Summary
We care a lot about performance in the TruffleRuby project. We run a set of benchmarks on every push in a variety of VM configurations and use those as proxies for system-wide issues. The problem with benchmarks, however, is unless you’re intimately familiar with the benchmark it’s hard to tell what your reported values should be. Looking at a graph, it’s easy to see if you’ve regressed or improved. It’s easy to see how you compare to other implementations. But it’s not terribly useful once you’ve leveled off. We really need another way to analyze performance.
This is a bit of a lengthy post that introduces some of the tools available to Truffle language developers for performance analysis. To help make things concrete, I walk through the end-to-end analysis of a simple Ruby method. If you’re just curious as to how we make Ruby faster, you can certainly skip over some of the finer details. I’ve tried to keep the post high-level enough to be interesting to those just curious about technology. If you’re developing a language in Truffle, you should find enough information here on how to get started in analyzing performance in your own language.
Introduction
In talking with Rubyists at various venues I’ve run into a lot of people that are curious about how a runtime is implemented, which is fantastic. Even if you’re writing in a high-level language day-to-day, it’s good to understand how things work under the covers. It can help you build better software and provide a better mental framework for debugging issues, performance or otherwise.
Unfortunately, there’s really no clear starting point for learning about how a runtime is built. In the absence of some golden path, I’m going to walk through the analysis and improvement of a single core method in Ruby. While I did pick this method out solely for the point of writing this blog post, the analysis and results are not contrived and the improved version of this method is now live in TruffleRuby.
To get started I looked at the compiled code resulting from running the Ruby language specs from the Ruby Spec Suite.
Generally, this isn’t a use case we pay much attention to because the code is short-lived and the executed paths won’t match more conventional workloads, such as serving web applications.
But, it was a nice simple example of real world code that I thought might yield some interesting insights.
One issue that caught my attention was how we were optimizing Array#empty?.
A substantial portion of the Ruby core library in TruffleRuby is authored in Ruby.
Array#empty? is one such method and its implementation is straightforward:
def empty?
  size == 0
end
Basically we have two method calls (Array#size and Fixnum#==) and a Fixnum literal reference.
Each of these methods is fairly simple, so let’s look at them first.
Tracing Compilation
We can instruct Truffle to print out trace details about its compilation by setting the Java system property -Dgraal.TraceTruffleCompilation=true.
We’ve simplified that a bit in TruffleRuby by way of our jt.rb tool.
To see the trace output for Fixnum#== call, I ran:
GRAALVM_BIN=path/to/graalvm-0.22/bin/java tool/jt.rb --trace -e 'loop { 3 == 0 }'
That yielded the following trace information:
[truffle] opt done Fixnum#== (builtin) <opt> <split-3dce6dd8> |ASTSize 8/ 8 |Time 79( 76+3 )ms |DirectCallNodes I 0/D 0 |GraalNodes 33/ 28 |CodeSize 147 |CodeAddress 0x7f5f287b5c10 |Source (core):1
Restructuring this as a table, we have:
| AST Nodes | 8 |
| AST + Inlined Call AST Nodes | 8 |
| Inlined Calls | 0 |
| Dispatched Calls | 0 |
| Partial Evaluation Nodes | 33 |
| Graal Lowered Nodes | 28 |
| Code Size (bytes) | 147 |
| Partial Evaluation Time (ms) | 76 |
| Graal Compilation Time (ms) | 3 |
| Total Compilation Time (ms) | 79 |
As a trace statement, some of this info can be daunting at first, but once you break it down it’s really not too bad.
We don’t need to make any extra method calls in Fixnum#==, so there are no inlined or dispatched calls.
Because we don’t inline any calls, the number of AST nodes in total is the same as the number of AST nodes for the Fixnum#== method itself.
After partial evaluation (i.e., the Truffle compilation phase), we have 33 compiler nodes.
After Graal is done processing those nodes, we have 28 compiler nodes being handed off to code generation.
We can see compiling the method took 79 ms, with most of that being spent during partial evaluation (76 ms).
The resulting compiled method is 147 bytes.
In general, we want to reduce compilation time and code size. If we can avoid dispatching method calls, that’s best too. The various node counts are interesting, but mostly as descriptive statistics. As we work on optimizing a method, we can compare current and previous counts of each of these metrics to see if we’re trending in a positive direction.
Visualizing the Compiler
To gain more insight into the Fixnum#== method, we can also visualize the transformations of the Truffle AST to a lowered graph using a tool known as the Ideal Graph Visualizer (IGV).
To start IGV, download a build, unzip it, cd into the unzipped directory, then run ./bin/idealgraphvisualizer.
Once running, we’ll feed data into IGV over the network.
You can instruct your Truffle language to dump graph data with the -Dgraal.Dump=Truffle system property & value.
The TruffleRuby jt tool makes this easier as well, by way of the --igv and --full flags.
GRAALVM_BIN=path/to/graalvm-0.22/bin/java tool/jt.rb --igv --full -e 'loop { 3 == 0 }'
IGV will show the compiler graph after each phase of compilation.
For our purposes, the phase “After Truffle Tier” is a good starting point.
It shows the state of the compiler after partial evaluation, partial escape analysis, and some other compilation passes Truffle performs, but before Graal begins its compilation phases.
Usually this is high level enough to still resemble source structure while low level enough to indicate what can be optimized.
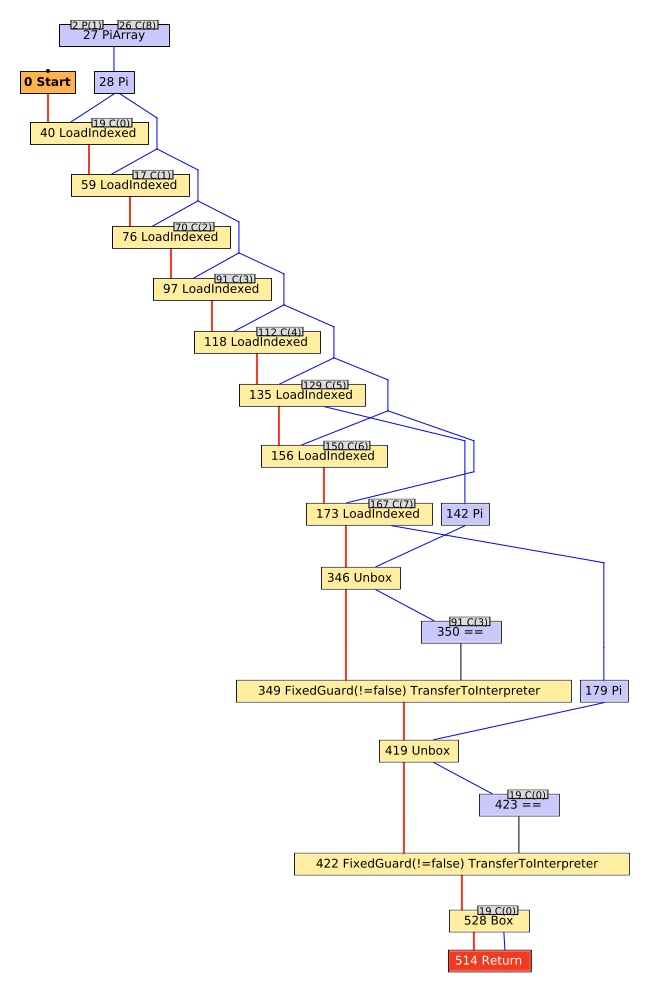
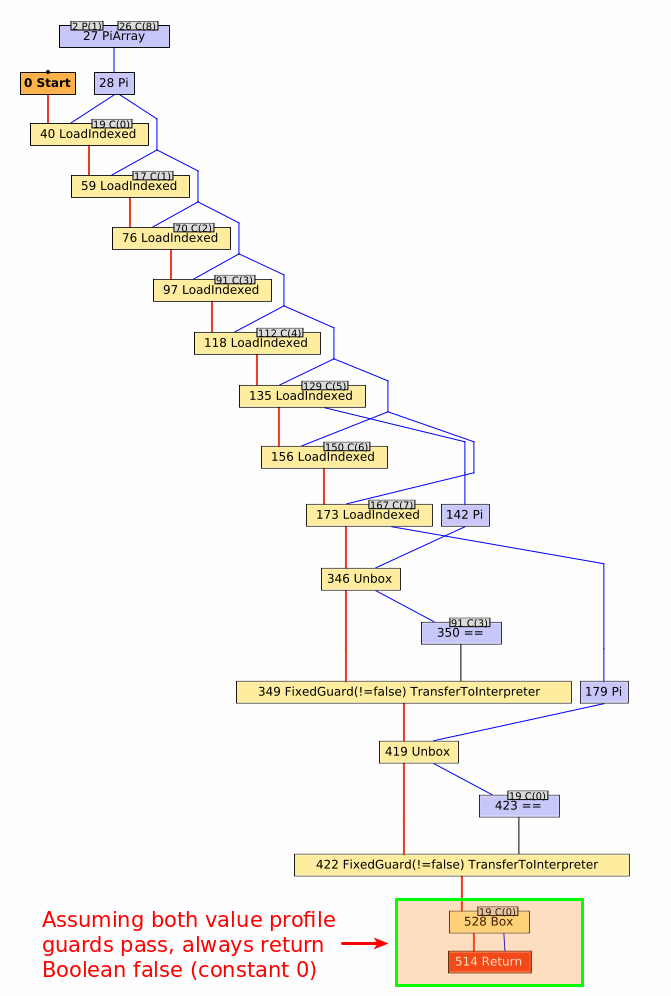
The compiler graph for Fixnum#== after Truffle has completed its partial evaluation looks like:
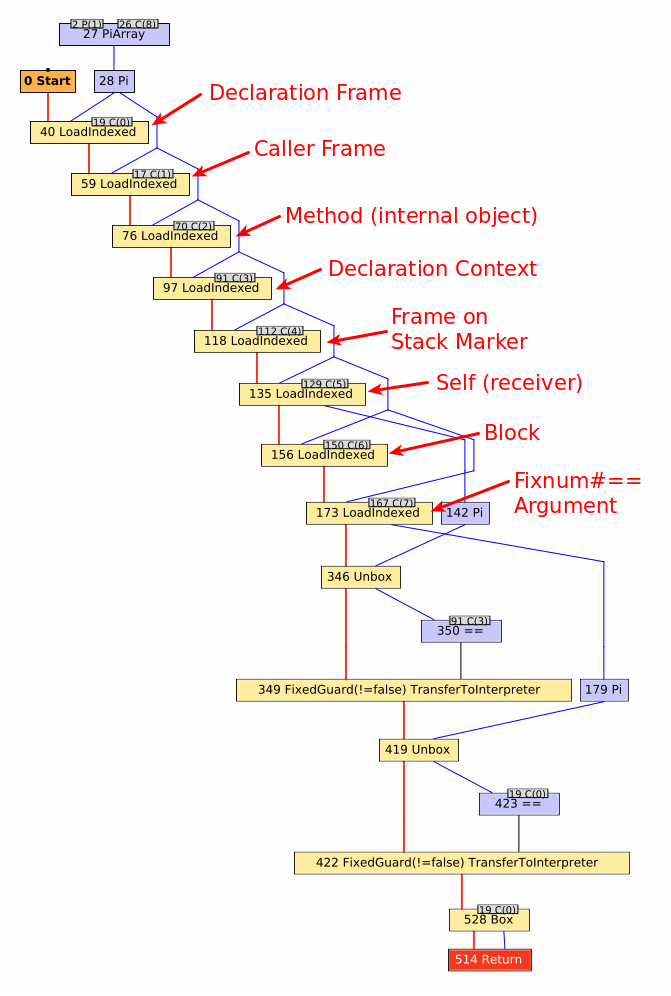
I’ve annotated various aspects of the graph, which you can see by scrolling through the image carousel.
Working from the top down to the bottom, we can trace entry of the Fixnum#== method through its exit.
First, we encounter several LoadIndexed nodes which simply correspond to reading an element from an array (one per read).
Every TruffleRuby method has an arguments array associated with it, consisting of both internal state and Ruby-level method arguments.
Consequently, every TruffleRuby method has some boilerplate to read each element out of that array so the method can execute.
The first 7 loads are for fixed fields that TruffleRuby uses to track state for the method.
Any subsequent LoadIndexed nodes correspond to the Ruby-level arguments for the method.
In this case, we have on argument for the Fixnum#== method.
Having run through our preamble, the remaining nodes correspond to the main functionality of the method.
You might expect a straightforward integer comparison, but it’s a bit trickier than that.
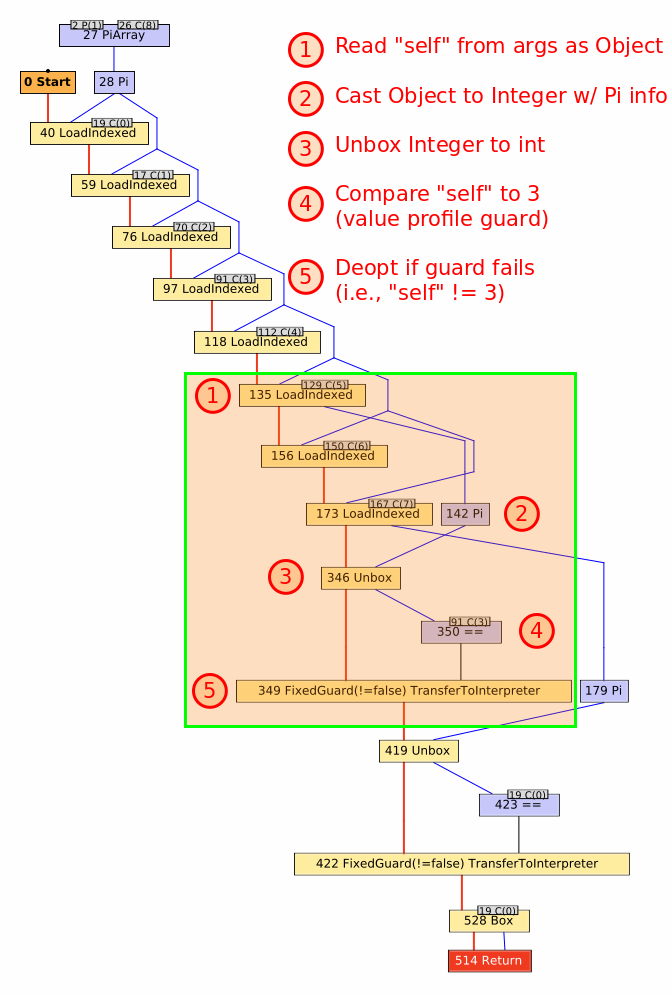
We treat Fixnums as boxed int or long in TruffleRuby, depending on the range of the value.
When the self value is read out of the arguments array, it is read as a java.lang.Object.
Along the way, Truffle notices that this is really a java.lang.Integer and notes that fact via a Pi node (node 142 in the graph).
That value is then unboxed to a primitive int via an Unbox node (node 346 in the graph).
Finally, the unboxed self is compared to another int.
While the original snippet was loop { 3 == 0 }, you’ll note that graph shows self being compared to 3, not 0 (node 350 in the graph with the constant 31 as an input).
In TruffleRuby, we use value profiles for all method arguments, including the receiver (self).
Value profiles are a way to speculatively optimize around the constantness of a value.
They have three basic states: uninitialized, constant, and generic.
The first time a value is seen, the state moves from uninitialized to constant.
On subsequent calls, the profile compares the passed value to the cached value.
If the values are the same it remains in its constant state, but if a new value is seen, it advances to its generic state, where it’ll remain for the life of the profile object.
So, what’s really happening here is self is being compared to the value cached in the value profile by way of a FixedGuard.
If self is not 3, then the guard fails and deoptimization occurs, discarding the compiled method, updating the value profile to note the receiver is generic, and switching back to the interpreter to execute the rest of the Fixnum#== method.
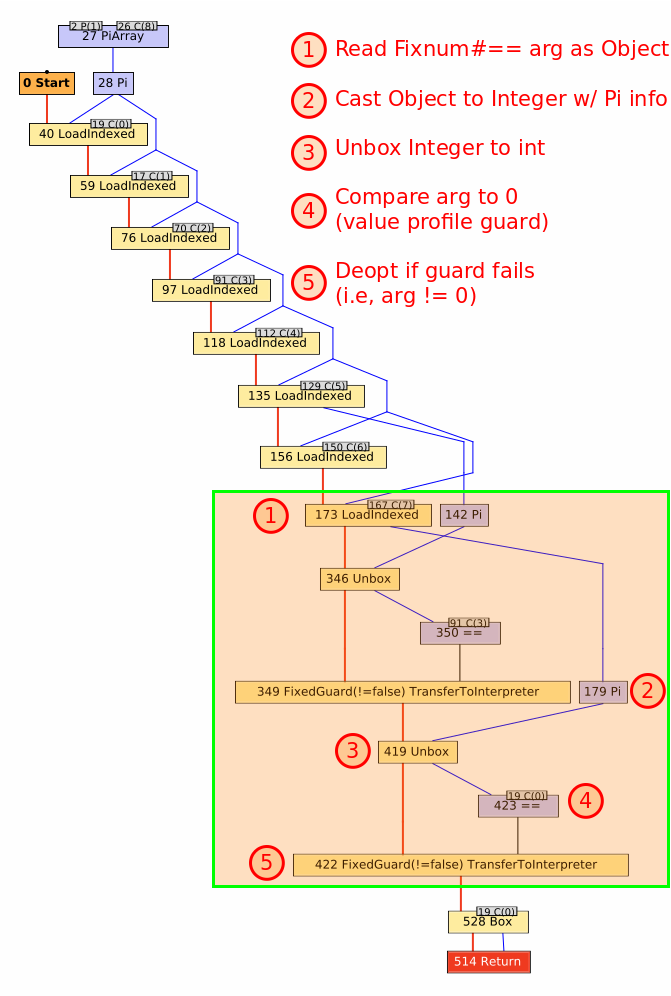
The next step is to run through a similar process for the Fixnum#== argument: unbox to a primitive int and compare it to its cached profile value of 0.
Again, if the guard fails then deoptimization occurs and the value profile for the argument is updated to note the argument is generic.
Note that this profile is different from the receiver profile, so value constantness is tracked independently amongst the method arguments.
Finally, the method returns a value, as indicated by the Return node.
You’ll note that self and the argument are never directly compared.
Instead, we always return a false value (represented as the constant integer value 0).
We can do this because of the value profiles on the receiver and the argument.
As long as those two values are constant, the result of the comparison will always be false.
This is important because by returning a constant value, Truffle can speculatively constant-fold the results of this method anywhere it is inlined.
We can safely do this because if either value changes, the compiled method (including any method it is inlined into) is discarded and we drop back to the interpreter, which will perform the direct integer comparison again.
The graph will go through many more transformations before ultimately emitting machine code.
Making sense of the graph after each of those transformations requires deeper understanding of Graal.
When working on a Truffle language, however, we can generally skip evaluation of those phases.
Looking at the graph after Truffle’s partial evaluator has run gives a good idea of what the compilation looks like with method inlining and constant-folding, while retaining enough of the shape of the original language AST to trace things back to their source.
In this case, we have a sensible implementation of Fixnum#== and the graph has a tight, linear structure to it, which generally optimizes very well.
Method Specialization
We can run through the entire analysis process for the Array#size call as well.
Note that TruffleRuby has two implementations for for this method: one for empty arrays and one for non-empty arrays.
GRAALVM_BIN=path/to/graalvm-0.22/bin/java tool/jt.rb --trace -e 'x = []; loop { x.size }'
GRAALVM_BIN=path/to/graalvm-0.22/bin/java tool/jt.rb --trace -e 'x = [1, 2, 3]; loop { x.size }'
I’ll skip the command-line trace info for these executions and collapse their trace data together into the same table:
| Metric | Empty Array | Non-empty Array |
|---|---|---|
| AST Nodes | 5 | 5 |
| AST + Inlined Call AST Nodes | 5 | 5 |
| Inlined Calls | 0 | 0 |
| Dispatched Calls | 0 | 0 |
| Partial Evaluation Nodes | 34 | 40 |
| Graal Lowered Nodes | 16 | 82 |
| Code Size (bytes) | 131 | 289 |
| Partial Evaluation Time (ms) | 49 | 59 |
| Graal Compilation Time (ms) | 3 | 5 |
| Total Compilation Time (ms) | 52 | 64 |
Comparing the two different implementations, we can see that they have the same number of AST nodes and method calls.
In fact, it’s the same exact AST for both implementations; what’s different is the structure of the receiver (i.e., the array instance).
In the empty array case, we simply always return 0.
For the non-empty array case, we must read the array length from the backing array store.
The difference here is quite large.
The generated code for the empty array case is 45% of the size of the non-empty array case.
The IGV graphs for these two specializations don’t add a whole lot more to the analysis, but for completeness I’ve linked to graphs for both the empty array and
non-empty array cases.
The big difference between these graphs and the simpler graph for Fixnum#== is the introduction of Truffle’s object storage model, which TruffleRuby uses to represent Ruby objects that are more complex than simple boxed primitive values.
Since the values aren’t boxed, we can’t unbox them, so the graphs also introduce the InstanceOf and ConditionAnchor compiler nodes for tracking type information.
And since we’re reading fields from objects now, you’ll see usages of the LoadField and GuardedUnsafeLoad nodes for loading data from an object.
Bringing it All Together
Now that we’ve seen what the Fixnum#== and Array#size methods look like on their own, we’re ready to see how they combine into Array#empty?.
For this analysis, I ran the Ruby language specs:
GRAALVM_BIN=path/to/graalvm-0.22/bin/java tool/jt.rb test --graal :language
This time, the trace details look a bit more interesting:
| AST Nodes | 19 |
| AST + Inlined Call AST Nodes | 32 |
| Inlined Calls | 2 |
| Dispatched Calls | 0 |
| Partial Evaluation Nodes | 112 |
| Graal Lowered Nodes | 48 |
| Code Size (bytes) | 263 |
| Partial Evaluation Time (ms) | 58 |
| Graal Compilation Time (ms) | 8 |
| Total Compilation Time (ms) | 66 |
We can see that two methods were inlined into Array#empty?.
We know the only two methods being called are Fixnum#== and Array#size, but we can also figure that out by looking at the total AST node count.
We see that Array#empty? consists of 19 AST nodes on its own and we know Fixnum#== has 8 nodes and Array#size has 5, which added together is 32: the same value reported for the size of the AST and its inlined nodes.
The large number of partial evaluation nodes sticks out a bit, as does the code size.
When looking at the IGV graph for the Array#empty? method, we see something that looks a fair bit more complicated than expected:

Given we know that Fixnum#== and Array#size have relatively compact graphs, why is this graph so large?2
When investigating these larger graphs, I usually start by looking for Phi nodes.
In this case, we can see one near the bottom of the graph, a few levels above the Return node.
A Phi node corresponds to a phi function in static single assignment form.
In a nutshell, they represent areas in the graph where Truffle sees multiple sources for an expression’s value, but can’t determine which one to choose.
Since it can’t determine which value to use, it can no longer constant-fold on that expression.
The Phi node structure resembles that of a multiplexer, with a control input determining which of the N data inputs will be output.
The first input (going left to right) is the control input and is followed by the data inputs.
In this case, we see the first data input is the constant value 0 and the second input is the result of a field load from some object.
The field load for the second data input looks very similar to the graph for the non-empty Array#size.
And we know that the empty Array#size can be reduced to the constant 0.
This suggests that the reason for the Phi node is we’re encountering both empty & non-empty arrays and, consequently, Truffle must compile in both specializations for Array#size.
We can verify that’s the case by tracing back the control input to a Merge node, which in this case represents the common path after two branches of an if statement finishes executing.
In all of the graphs up until now, I’ve removed frame state nodes in IGV since they’re often just clutter.
By enabling them, however, you can get additional context that might help in your analysis.
In the following extraction of the primary graph, but with frame states enabled, we can see that Array#size has indeed become polymorphic, meaning multiple specializations for the method are active in this compilation unit.
Now that we have a likely culprit, what can we do about it? Answering that question requires understanding a little more about how Truffle optimizes code.
Method Splitting
At this point in the analysis, we’re blaming Array#size being polymorphic for the complexity in the Array#empty? compiled method.
Array#size being polymorphic isn’t a bad thing in and of itself, but it looks like the two different Array#size specializations prevent Array#empty? from doing an optimal job.
A naive solution is to discard the specialization for empty arrays. The specialization for non-empty arrays will handle the empty array case just fine, but it will incur additional overhead and can’t reduce to a constant value. However, eliminating the empty array specialization works against Truffle. With Truffle, we want to break down methods into their constituent cases.
Typically a call site for a method isn’t going to exercise every branch in that method.
By breaking a method down into its various cases and specializing for them, we can improve the quality of compiled code markedly for common cases.
To help us keep call sites monomorphic, Truffle can “split3” a method.
With method splitting, a clone of the uninitialized graph corresponding to a method is made and inserted at a particular call site.
That way if two different pieces of code are calling Array#size and one always has an empty array and the other always a non-empty array, they each have their own copy of Array#size optimized for their respective case.
So, the real problem here isn’t that we have multiple specializations for Array#size, but rather that the splitting strategy isn’t optimal.
By default, Truffle makes splitting decisions based on a set of internal heuristics and observed execution profiles at runtime.
The Truffle API allows language implementors to exert more control over the process by forcing splitting where appropriate.
TruffleRuby implements the Ruby language both in Java and in Ruby itself.
We currently use a very coarse heuristic that methods implemented in Java are the most critical and as such we instruct Truffle to always split them.
Both Array#size and Fixnum#== are implemented in Java and thus are always split.
However, splitting every method in our runtime would result in massive explosion in graph size, so we do not force splitting of methods written in Ruby, such as Array#empty?.
It appears in this situation we haven’t given Truffle enough information to make an optimal splitting decision.
As a result, Array#empty? isn’t split and all of its callers ends up sharing a single copy of the method.
Moreover, even though Array#size is instructed to split, splitting only occurs at unique call sites.
Since we have a single shared copy of Array#empty? there’s only one call site for Array#size and as a result, Array#size becomes polymorphic as well.
Improving the Method
Unfortunately, improving Truffle’s splitting heuristics is a research project unto itself.
But, I wanted to show an improvement in compilation so we could do a before-and-after comparison of the compiler graphs.
As it turns out, we can improve Array#size by using a single specialization with a value profile on the return value.
At first blush this sounds like I’m backtracking on my previous assertion that we do not want to eliminate the special handling of empty arrays.
However, by adding a value profile on the return value we’re able to achieve our original goal of returning a constant value for empty arrays.
You might recall that we already have value profiles established for each argument to a method.
In the case of Fixnum#== this is sufficient to get a constant return value because the arguments are unboxed to primitive ints and comparing the exact same two ints always returns the same value.
Ruby arrays are mutable, however, so we can’t cache the method result based on object identity; Array#size must always read the length field from the underlying store.
And since we can’t know a priori what the length of an arbitrary array is, the return value is variable.
In our initial implementation of Array#size we specialized on empty arrays by explicitly returning the constant value 0, while non-empty arrays returned the variable result of the loaded field length.
By adding a value profile on the result of the length field load, we can return a constant value for Array#size of both empty & non-empty arrays, as long as the profile doesn’t become generic.
For monomorphic call sites, calling Array#size on an empty array will still return a constant value 0.
As an added bonus, non-empty arrays will now also return a constant value, providing the array size doesn’t change.
And we’ve eliminated the need for two specializations to be compiled in for polymorphic call sites.
With the new implementation the performance profile for the empty & non-empty array cases is now identical and smaller than the original. Note that compilation times are non-deterministic; despite compiling the exact same graph, we see some variance in how long it takes compilation to complete.
| Metric | Empty Array | Non-empty Array |
|---|---|---|
| AST Nodes | 5 | 5 |
| AST + Inlined Call AST Nodes | 5 | 5 |
| Inlined Calls | 0 | 0 |
| Dispatched Calls | 0 | 0 |
| Partial Evaluation Nodes | 34 | 34 |
| Graal Lowered Nodes | 17 | 17 |
| Code Size (bytes) | 130 | 130 |
| Partial Evaluation Time (ms) | 49 | 63 |
| Graal Compilation Time (ms) | 3 | 2 |
| Total Compilation Time (ms) | 52 | 65 |
More importantly, this new Array#size implementation allows Truffle to perform more optimizations in Array#empty?.
Re-running the Ruby language specs, we now see:
| Metric | Old Array#empty? | New Array#empty? |
|---|---|---|
| AST Nodes | 19 | 19 |
| AST + Inlined Call AST Nodes | 32 | 32 |
| Inlined Calls | 2 | 2 |
| Dispatched Calls | 0 | 0 |
| Partial Evaluation Nodes | 112 | 42 |
| Graal Lowered Nodes | 48 | 26 |
| Code Size (bytes) | 263 | 176 |
| Partial Evaluation Time (ms) | 58 | 57 |
| Graal Compilation Time (ms) | 8 | 5 |
| Total Compilation Time (ms) | 66 | 62 |
The new Array#empty? (really, the same method but with a better Array#size) has almost 1/3 the number of nodes after partial evaluation and is about 2/3 the code size.
If we look at the compiled method in IGV now, we see a much simpler graph:
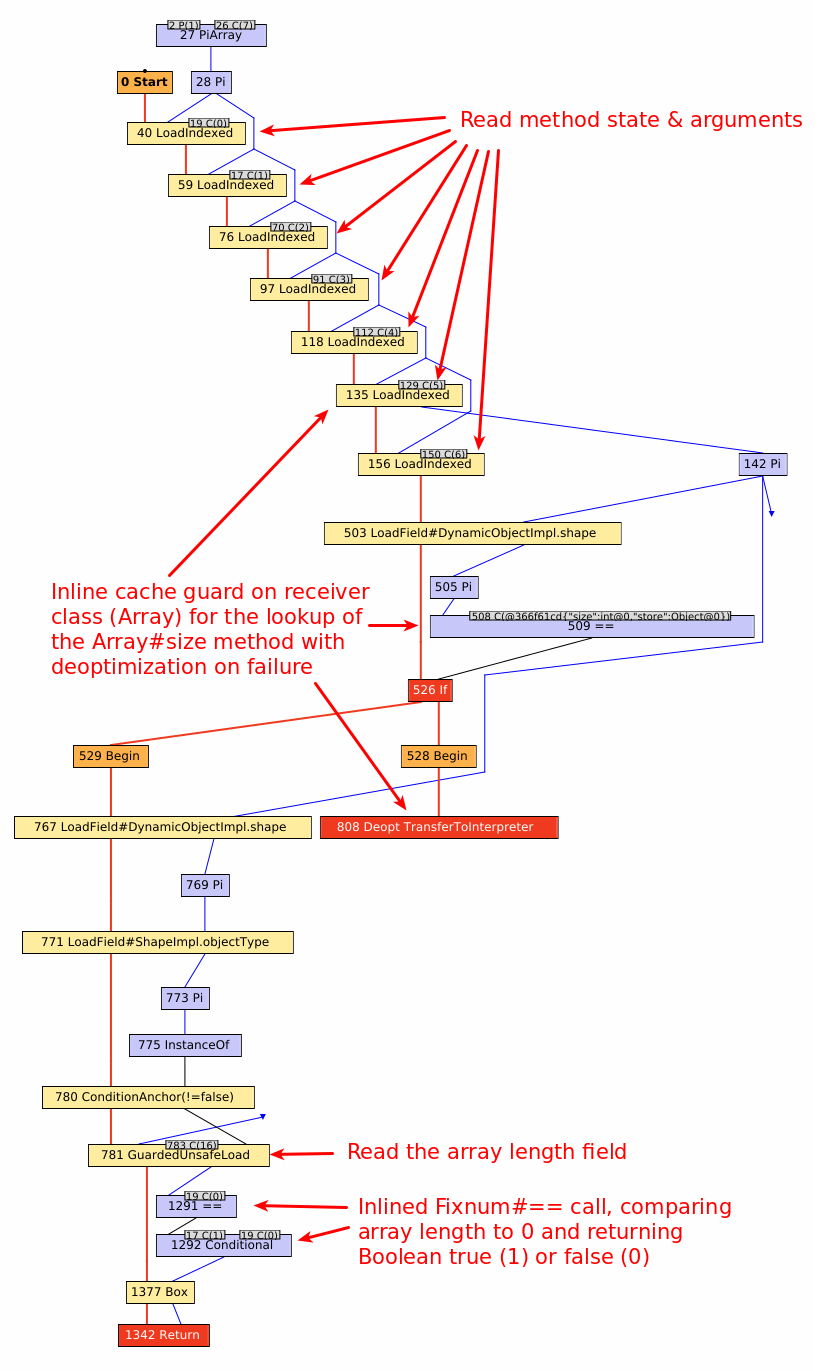
This graph looks much more like the composition of the Array#size and Fixnum#== graphs we would expect to see.
The only thing that should look foreign at this point is the introduction of the inline cache right around the middle of the graph.
This was present in the old Array#empty? implementation as well, but was buried in a much larger graph.
Since Array#empty? calls Array#size, we need to ensure we call the correct size method.
To avoid expensive dynamic method lookups, TruffleRuby uses a polymorphic inline cache.
What you see here is a guard on the receiver type to ensure the cached method lookup is valid, triggering deoptimization if it is not.
Unfortunately, we can’t return a constant value from Array#empty? without splitting the method.
The method is called in multiple places during TruffleRuby’s bootstrap process and becomes polymorphic before end-user code is even executed.
In practice, this may not be a real problem because the output of the method is a boxed bool, which is likely to be fed as the input into another method, which will have value profiling enabled on the arguments.
Conclusion
When it comes to performance analysis we often turn to benchmarks and profilers. Both are great tools in their own right, but they often lack granularity. Truffle’s tracing output and IGV provide lower-level metrics that can be used to improve a method’s compilation.
As a Truffle language developer, ensuring our code is amenable to Truffle’s partial evaluator is one of the most important things we can do.
So, while a lot of the preceding discussion looks like micro-optimization, it’s the sort of thing that can have large cascading consequences.
E.g., eliminating Phi nodes generally allows Truffle to perform more extensive constant folding.
I think perhaps the most important part of all this is you don’t need to be a compiler expert to help the compiler out. You don’t even need to be able to evaluate the resulting machine code. If you know the basic rules of how to play nicely with Truffle you can go really far. Granted, reading the IGV graphs does take some getting used to — there’s still a fair bit I don’t understand! But you can get pretty far with pattern matching after learning the basics. You can easily test out a hypothesis in a high level language (Java or Ruby, in this case) and compare the before & after metrics. To me, that’s incredibly powerful.
Acknowledgements
Pulling all of this info together took quite a while. Many thanks to Chris Seaton, Benoit Daloze, and Petr Chalupa for reviewing drafts, suggesting improvements, and catching errors.
1
C(x) is an IGV shorthand for constant integer value x.
2 Calling this a “large” graph is a bit misleading. Certainly it’s larger than any other graph in the blog post, but it’s actually quite small by Truffle standards. If you’re performing your own analysis of a method in Truffle, please don’t take this graph as a benchmark of typical graph size.
3 In the original “One VM to Rule Them All” paper, method splitting is referred to as “tree cloning.” You can consult the paper for a more thorough treatment of the topic.
